Using Python Package
You can use a Chromoscope Python package to visualize your local SV files directly on computational notebooks, such as Jupyter Notebook, Jupyter Lab, and Google Colab.
Installation
You can install the Python package using pip on your terminal.
pip install chromoscope
Open Jupyter Lab
jupyter lab
We here use Jupyter Lab as an example, but you can also use Jupyter Notebook or Goolge Colab.
Setup Data Config
In the Data Config, you can specify either a URL to a remote file or a path to the local file on your computer.
!wget https://somatic-browser-test.s3.amazonaws.com/SVTYPE_SV_test_tumor_normal_with_panel.bedpe

config = [{
    "id": "SRR7890905",
    "cancer": "breast",
    "assembly": "hg38",
    "sv": "./SVTYPE_SV_test_tumor_normal_with_panel.bedpe", # path to a local file
    "cnv": "https://gist.githubusercontent.com/sehilyi/6fbceae35756b13472332d6b81b10803/raw/596428a8b0ebc00e7f8cbc52b050db0fbd6e19a5/SRR7890943.ascat.v3.cnv.tsv" # URL to a remote file
}]
Visualize
Using the data config, you can display Chromoscope visualization.
from chromoscope import Viewer

Viewer.from_config(config)
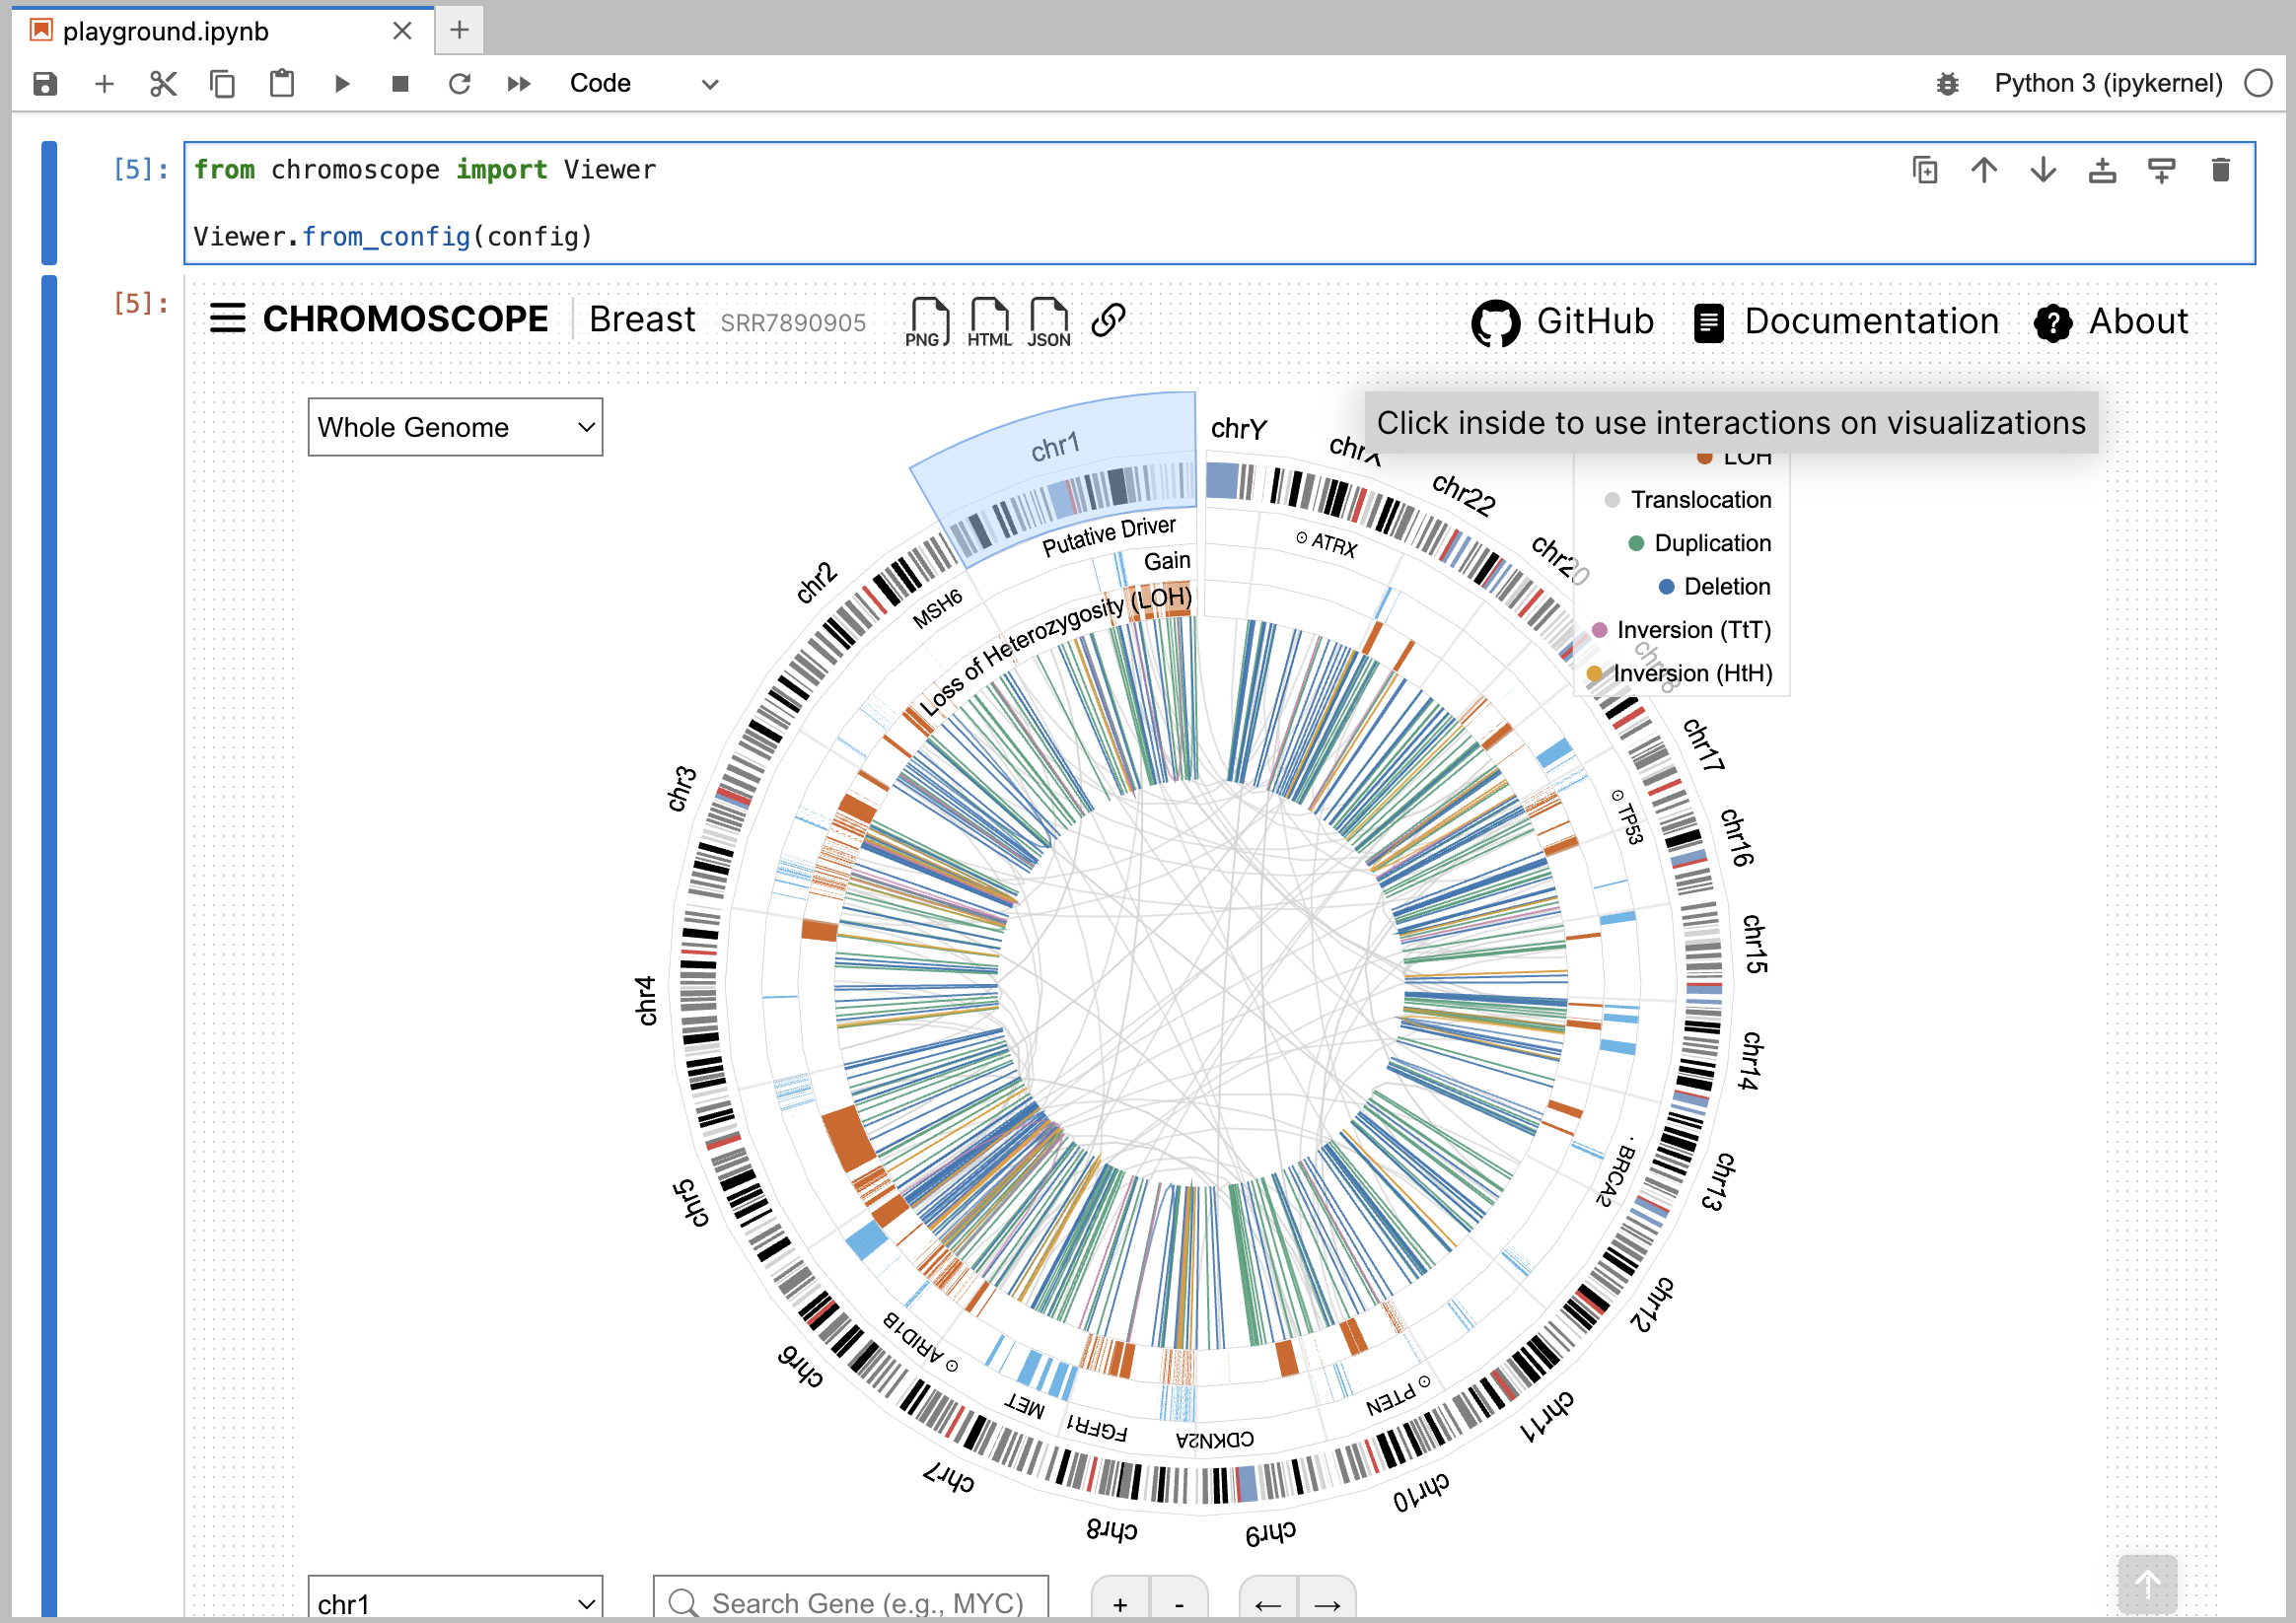 |
|---|
| Figure. Using a Chromoscope Python package on Jupyter Lab |