Genome View
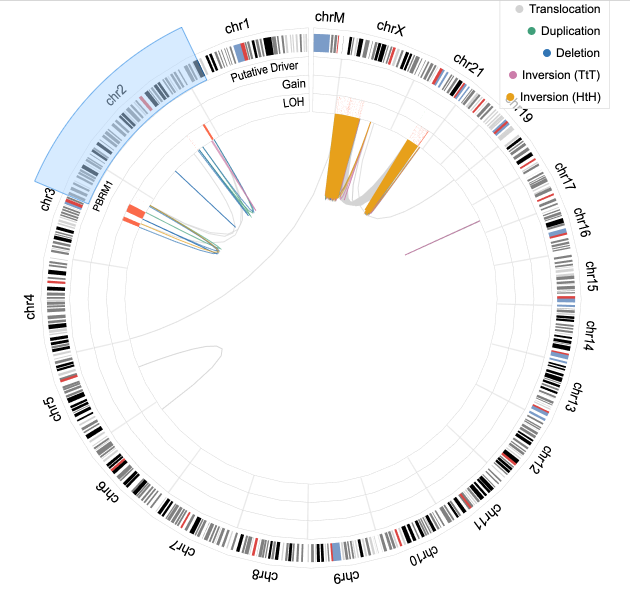
The genome view shows the selected sample in a circular visualization. This uses the visual representations that are similar to the ones on the cohort view but shows several additional tracks, such as chromosome ideograms and putative drivers.
 |  |
|---|---|
| Figure. Genome View with an interactive brush for selecting a region of interest. | Figure. A tooltip showing detailed information. |
Interactions
- You can move or resize an interactive brush (light blue) using the mouse. This is linked with a variant view that is shown on the bottom of the genome view.
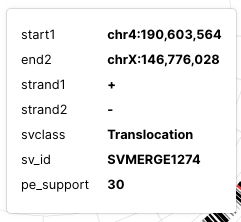
- You can move your mouse on top of a structural variant to see detailed information on a tooltip.